The severe lack of housing inventory is being pegged as the cause for continuously increasing home prices and a slight decline in buyer demand, according to a pair of data reports released this morning.
The S&P CoreLogic Case-Shiller U.S. National Home Price NSA Index reported a 6.5 percent annual gain in March, the same as the previous month. The 10-City Composite annual increase also came in at 6.5 percent, up from 6.4 percent in February, while the 20-City Composite posted a 6.8 percent year-over-year gain, unchanged from the previous month.
Before the seasonal adjustment, the National Index posted a month-over-month gain of 0.8 percent in March while the 10-City and 20-City Composites reported increases of 0.9 percent and 1 percent, respectively. After the seasonal adjustment, the National Index recorded a 0.4 percent month-over-month increase in March as the 10-City and 20-City Composites posted 0.4 percent and 0.5 percent month-over-month increases, respectively. All 20 cities reported increases in March before seasonal adjustment, while 19 of 20 cities reported increases after seasonal adjustment. Seattle recorded the highest year-over-year gains at 13 percent, followed by Las Vegas with a 12.4 percent spike and San Francisco with an 11.3 percent upswing.
David M. Blitzer, Managing Director and Chairman of the Index Committee at S&P Dow Jones Indices, cited inventory shortages as contributing to the state of non-stop home price increases.
“Months-supply, which combines inventory levels and sales, is currently at 3.8 months, lower than the levels of the 1990s, before the housing boom and bust,” Blitzer said. “Until inventories increase faster than sales, or the economy slows significantly, home prices are likely to continue rising.”
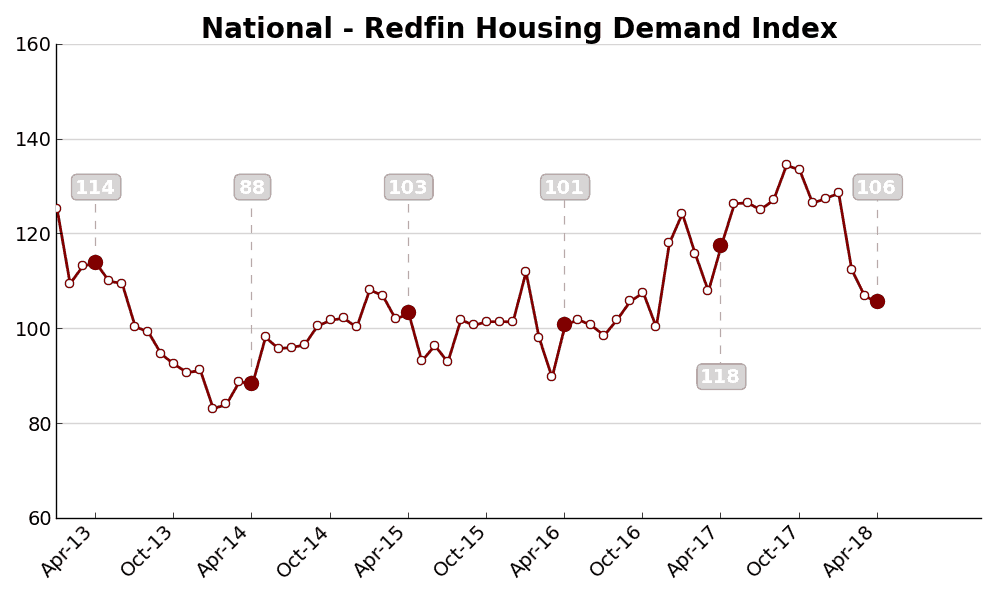
Separately, Redfin announced that its Housing Demand Index fell 1.3 percent from March to April, reaching a level of 106. This marked the third consecutive month of declines this year. The index was also down by 11.5 percent from one year earlier.
“April was the first time in 27 months that we saw a year-over-year decline in the number of customers touring homes,” said Redfin Chief Economist Nela Richardson. “We believe this was driven by the low levels of new listings in March.”
From March to April, the seasonally adjusted number of buyers requesting home tours fell by 1.4 percent, while the number of buyers making offers was down by 1.8 percent. Across the 15 metros covered by the Demand Index, the number of homes for sale was 7.3 percent lower on a year-over-year measurement, which makes April the 35th consecutive month of falling supply. However, the quantity of newly listed homes for sale increased 6.6 percent in April compared to a year earlier.